Measuring True Impact: Key Metrics for Social Programs in the U.S. to Track in 2026

Anúncios
In an era demanding greater accountability and demonstrable results, U.S. social programs face increasing pressure to prove their worth. As we look towards 2026, the landscape for impact measurement is evolving rapidly. Moving beyond simple output tracking, organizations are now expected to articulate and measure the true, long-term impact of their interventions. This shift necessitates a strategic approach to identifying and tracking key social program metrics that genuinely reflect positive change in communities and individuals.
Understanding and implementing effective social program metrics is not merely a bureaucratic exercise; it is fundamental to securing funding, building trust with stakeholders, and, most importantly, optimizing programs to better serve those in need. This comprehensive guide will delve into the essential metrics for U.S. social programs to track in 2026, offering insights into how to move from data collection to meaningful impact assessment.
Anúncios
The Evolving Landscape of Social Program Metrics
For decades, many social programs focused predominantly on easily quantifiable outputs: the number of meals served, individuals housed, or training sessions conducted. While these metrics provide a basic understanding of activity, they often fall short in illustrating whether the program achieved its ultimate goal of improving lives. The current trend, which will solidify by 2026, emphasizes outcomes and long-term impact.
Funders, policymakers, and the public are increasingly demanding evidence of systemic change. This means programs must articulate not just what they do, but what difference they make. This pivot requires a more sophisticated approach to data collection, analysis, and reporting, prioritizing metrics that speak to the quality of life improvements, sustained behavioral changes, and broader societal benefits.
Anúncios
Moreover, the integration of technology, particularly data analytics and AI, is transforming how social program metrics are collected and interpreted. Predictive analytics can help identify individuals most at risk or programs most likely to succeed, enabling more targeted and efficient interventions. Cloud-based platforms are streamlining data management, making it easier for organizations to track progress in real-time and adapt their strategies accordingly.
Key Categories of Social Program Metrics for 2026
To effectively measure impact, social programs should consider a balanced scorecard of social program metrics across several key categories. These categories ensure a holistic view of program effectiveness, from immediate engagement to long-term societal change.
1. Participant Engagement and Reach Metrics
Before impact can be achieved, individuals must engage with the program. These metrics assess the program’s ability to attract, retain, and effectively serve its target population.
- Number of Participants Served: The foundational metric, indicating the raw count of individuals benefiting from the program. By 2026, this should be disaggregated by demographics (age, gender, ethnicity, socioeconomic status) to ensure equitable reach.
- Participant Retention Rate: The percentage of participants who complete a program or remain engaged over a specified period. High retention often correlates with greater impact.
- Attendance/Engagement Frequency: For ongoing programs, this measures how often participants interact with services or activities.
- Reach vs. Need: Analyzing the percentage of the target population reached relative to the total estimated need in the community. This helps identify service gaps.
- Accessibility Metrics: Data on barriers to participation (e.g., transportation issues, language barriers, digital divide) and how the program addresses them.
2. Output Metrics (What the Program Delivers)
While moving beyond outputs is crucial, they remain important as indicators of program activity and operational efficiency. These are the direct products of a program’s activities.
- Services Delivered: The volume of specific services provided (e.g., number of counseling sessions, workshops conducted, housing units secured).
- Resources Distributed: Quantity of goods or financial aid provided (e.g., pounds of food distributed, amount of financial assistance).
- Staff-to-Participant Ratios: Relevant for programs where individualized attention is key, indicating resource allocation.
3. Outcome Metrics (Changes in Participants)
These are the heart of impact measurement, reflecting the direct changes experienced by participants as a result of the program. Outcomes can be short-term, medium-term, or long-term.
Short-Term Outcomes:
- Knowledge/Skill Acquisition: Measured through pre/post-tests, certifications, or self-reported confidence levels (e.g., increased financial literacy, improved parenting skills).
- Behavioral Changes: Observable shifts in participant actions (e.g., increased job-seeking activities, reduced substance use, improved dietary habits).
- Attitudinal Shifts: Changes in beliefs, perceptions, or self-efficacy (e.g., increased self-esteem, reduced stigma, greater hope for the future).
- Access to Resources: Successful connection to external services or benefits (e.g., enrollment in health insurance, securing a primary care physician).
Medium-Term Outcomes:
- Educational Attainment: High school graduation rates, GED completion, enrollment in higher education or vocational training.
- Employment Status: Securing stable employment, increased income, career advancement.
- Housing Stability: Maintaining stable housing, avoiding homelessness.
- Health Improvements: Reductions in chronic disease symptoms, improved mental health scores, increased access to preventative care.
- Reduced Recidivism: For justice-involved programs, a decrease in re-arrests or re-offenses.
Long-Term Outcomes (Impact Metrics):
These are the ultimate goals, often reflecting sustained changes and broader societal benefits. Measuring these requires longitudinal data collection.
- Economic Self-Sufficiency: Sustained income above poverty line, asset building, reduced reliance on public assistance.
- Community Integration: Increased civic engagement, reduced social isolation, positive relationships with community members.
- Intergenerational Impact: Positive effects on children of participants (e.g., improved educational outcomes for children of parents who completed a parenting program).
- Systemic Change: Influence on policy, reduction in community-wide issues (e.g., lower crime rates, improved public health indicators in a target area).
4. Efficiency and Cost-Effectiveness Metrics
Demonstrating impact is vital, but so is proving that programs are run efficiently and provide good value for money. These social program metrics are increasingly important for funders.
- Cost Per Participant: Total program cost divided by the number of participants served.
- Cost Per Outcome Achieved: A more sophisticated metric, calculating the cost associated with each successful outcome (e.g., cost per person who gains stable employment).
- Return on Investment (ROI): For programs with quantifiable economic benefits (e.g., reduced healthcare costs, increased tax revenue from employed individuals), ROI can be a powerful metric.
- Administrative Overhead Ratio: The percentage of total expenses dedicated to administrative costs versus direct program services.
5. Equity and Inclusion Metrics
In 2026, a strong emphasis will be placed on ensuring that social programs are not only effective but also equitable and inclusive. These metrics assess whether programs are reaching and serving all segments of the population, especially marginalized groups, fairly.
- Disaggregated Outcome Data: Analyzing outcomes by race, ethnicity, gender, disability status, sexual orientation, and other relevant demographic factors to identify disparities.
- Representation in Leadership/Staffing: Ensuring program staff and leadership reflect the diversity of the communities served.
- Participant Feedback on Inclusivity: Surveys or focus groups specifically asking about experiences with cultural sensitivity, accessibility, and belonging within the program.
- Access for Underserved Populations: Tracking efforts and success rates in engaging populations historically excluded or difficult to reach.
6. Stakeholder Satisfaction Metrics
The perspectives of participants, staff, and partners offer crucial qualitative data that complements quantitative social program metrics.
- Participant Satisfaction: Surveys, interviews, or feedback forms assessing satisfaction with program services, staff, and overall experience.
- Staff Satisfaction/Turnover: High staff morale and low turnover often correlate with program stability and effectiveness.
- Partner Satisfaction: Feedback from collaborating organizations on the effectiveness and efficiency of partnerships.
Implementing a Robust Measurement Strategy for Social Program Metrics
Tracking these social program metrics effectively requires a well-thought-out strategy. Here are key steps for U.S. social programs to prepare for 2026:
1. Define Your Theory of Change and Logic Model
Before measuring, clearly articulate how your program is supposed to work. A Theory of Change maps out the causal pathways from your activities to your desired short-term, medium-term, and long-term outcomes. A Logic Model provides a visual representation of inputs, activities, outputs, and outcomes. These frameworks are essential for identifying the most relevant social program metrics.
2. Choose the Right Metrics (Less is Often More)
Resist the temptation to track everything. Focus on a manageable number of social program metrics that are:
- Relevant: Directly linked to your program goals and Theory of Change.
- Measurable: Quantifiable or observable.
- Attainable: Data can be realistically collected with available resources.
- Timely: Data can be collected and analyzed in a timeframe that allows for program adjustments.
- Informative: Provide actionable insights for program improvement.
3. Invest in Data Collection and Management Systems
Manual data collection is prone to errors and inefficiency. By 2026, robust data management systems will be non-negotiable. Consider:
- Client Relationship Management (CRM) Software: For tracking participant data, interactions, and progress.
- Specialized Program Management Software: Tailored to the needs of specific social service sectors.
- Survey Tools: For collecting participant feedback and outcome data.
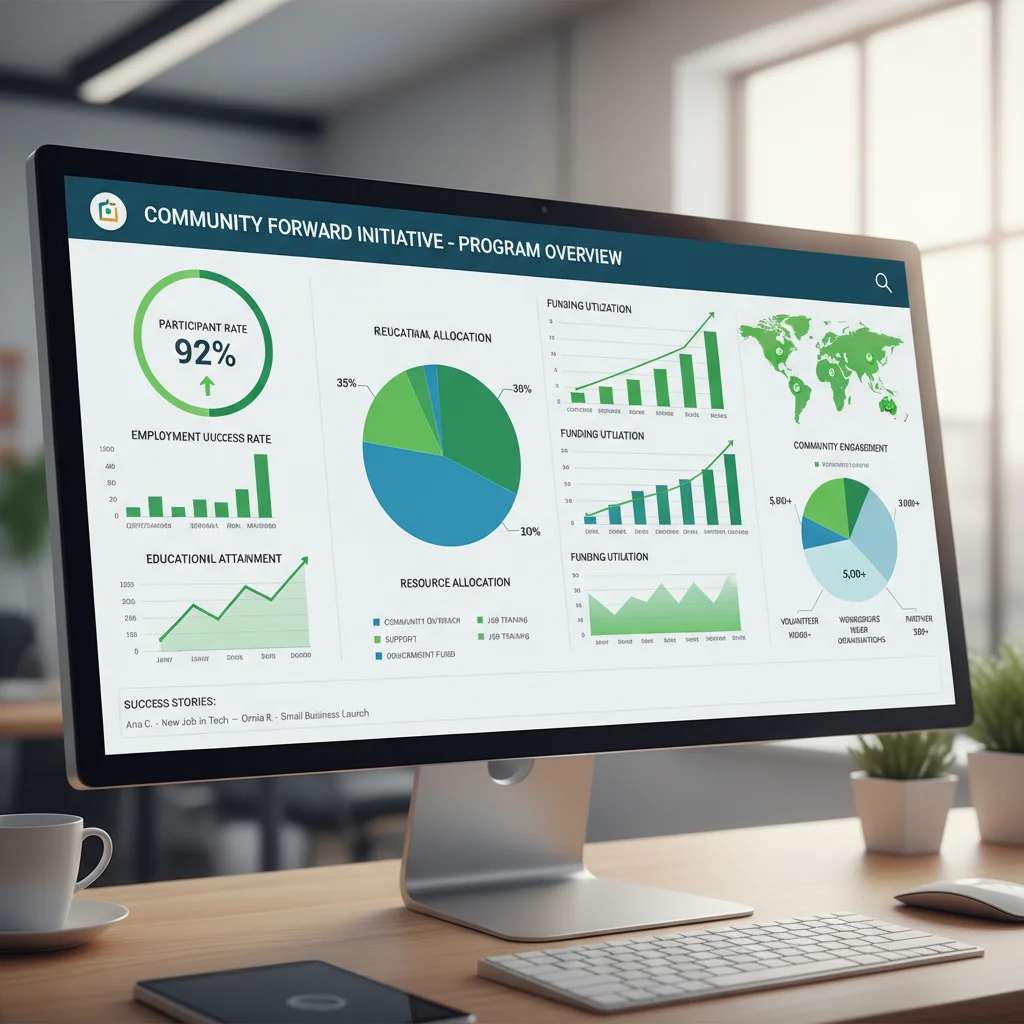
- Data Dashboards: For visualizing social program metrics in an easily digestible format for staff, board members, and funders.
4. Prioritize Data Quality and Integrity
Garbage in, garbage out. Ensure your data is accurate, consistent, and reliable. This involves:
- Standardized Data Entry Protocols: Clear guidelines for staff on how to collect and enter data.
- Regular Data Audits: Periodically reviewing data for errors or inconsistencies.
- Staff Training: Equipping staff with the skills to accurately collect and understand data.
5. Embrace Mixed Methods (Quantitative and Qualitative)
While quantitative social program metrics provide the ‘what,’ qualitative data provides the ‘why’ and ‘how.’ Incorporate:
- Surveys: With both Likert scales and open-ended questions.
- Interviews: One-on-one conversations with participants, staff, and stakeholders.
- Focus Groups: Group discussions to gather diverse perspectives.
- Case Studies: In-depth examinations of individual participant journeys.
6. Regularly Analyze and Utilize Data
Collecting data is only half the battle. The true value lies in its analysis and application. Regularly review your social program metrics to:
- Identify Trends: Spot patterns in participant progress or program effectiveness.
- Pinpoint Areas for Improvement: Understand where the program might be falling short and why.
- Make Data-Driven Decisions: Adjust program design, resource allocation, and outreach strategies based on evidence.
- Report to Stakeholders: Communicate impact effectively to funders, board members, and the community.

Challenges and Considerations for 2026
While the focus on robust social program metrics offers immense benefits, organizations must be prepared for potential challenges.
Funding for Measurement Capacity
Developing and maintaining sophisticated measurement systems requires resources – staff time, technology, and expertise. Funders increasingly expect strong evaluation but don’t always provide dedicated funding for it. Advocacy for dedicated evaluation budgets will be crucial.
Data Privacy and Security
As more sensitive personal data is collected, ensuring compliance with privacy regulations (like HIPAA, where applicable) and maintaining robust cybersecurity measures will be paramount. Building trust with participants regarding data usage is also essential.
Attribution vs. Contribution
It can be challenging to definitively attribute outcomes solely to one program, especially when participants are involved in multiple interventions or influenced by external factors. Programs will need to focus on demonstrating their contribution to positive change, often through robust comparison groups or quasi-experimental designs.
The Risk of “Teaching to the Test”
An overemphasis on certain social program metrics can sometimes lead programs to prioritize activities that improve those specific metrics, potentially at the expense of holistic participant needs or broader impact. A balanced set of metrics and qualitative data can help mitigate this.
Longitudinal Data Collection
Measuring long-term impact requires tracking participants over extended periods, which can be resource-intensive and challenging due to participant mobility or loss of contact. Strategies like incentivizing follow-up, leveraging administrative data, and building strong participant relationships will be key.
The Future of Social Program Metrics: Predictive Analytics and AI
Looking towards 2026 and beyond, advanced technologies will play an even greater role in shaping social program metrics. Predictive analytics, powered by artificial intelligence and machine learning, can analyze vast datasets to identify patterns and predict future outcomes. This could revolutionize how programs operate:
- Early Warning Systems: Identifying participants at risk of dropping out or experiencing setbacks, allowing for proactive intervention.
- Personalized Interventions: Tailoring program components to individual needs based on predicted efficacy.
- Resource Optimization: Directing resources to areas where they are likely to have the greatest impact.
- Forecasting Community Needs: Anticipating future social challenges to design preventative programs.
However, the ethical implications of using AI in social programs must be carefully considered, particularly regarding bias in algorithms and ensuring equitable access to technology.
Conclusion
The journey towards measuring true impact in U.S. social programs by 2026 is one of continuous improvement and adaptation. By strategically selecting and rigorously tracking key social program metrics across participant engagement, outputs, outcomes, efficiency, equity, and satisfaction, organizations can move beyond simply reporting activities to demonstrating profound and lasting change.
Embracing a data-driven culture, investing in appropriate technologies, and fostering a commitment to learning and adaptation are not just best practices; they are essential for the sustainability and success of social programs in the coming years. The ultimate goal is to ensure that every dollar spent and every effort made translates into tangible, positive differences in the lives of individuals and the health of communities across the United States. The future of social good hinges on our collective ability to measure what truly matters.


